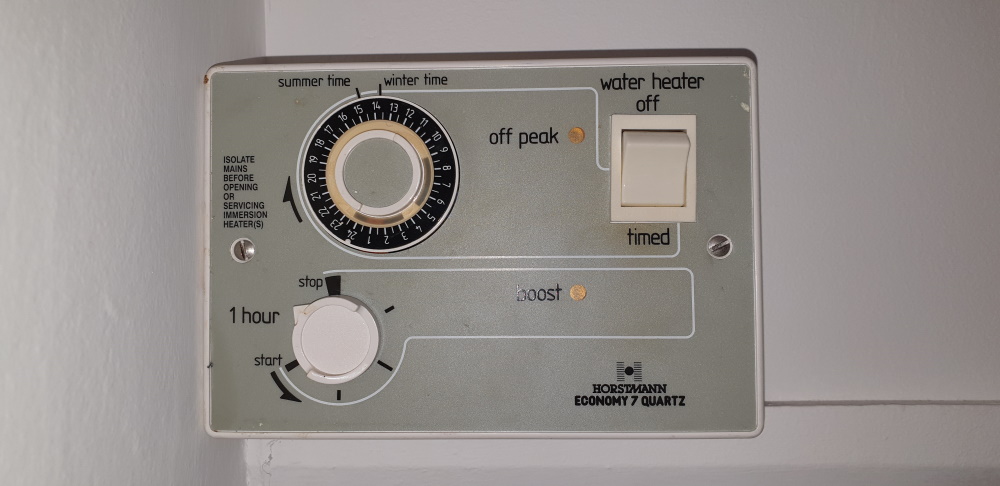
I have electrically heated hot water in my house, and it takes ages to heat a whole tank. It heats up overnight on low cost electricity and we use it during the day. One constant frustration I have is there is no way of knowing how much hot water is left in the tank. I have to canvas my family and interrogate them on who’s had a shower or bath and how much washing up has been done. It would be so much better if I had a web page that showed the remaining hot water level in the tank !?
So, I attached temperature sensors up the side of the hot water tank and monitored them with a Raspberry Pi, of course ! 🙂
I have always wanted to use 1-wire devices in a project, and this was the perfect project. 1-wire devices make the cabling of many sensors easy as they all sit on a shared bus. You can get away with just 2 wires, a signal and a ground, as the devices can consume parasitic power from the signal line before communicating. However, to avoid any power issues and as I didn’t have a problem running more wires, I opted for three wires, power, signal and ground.
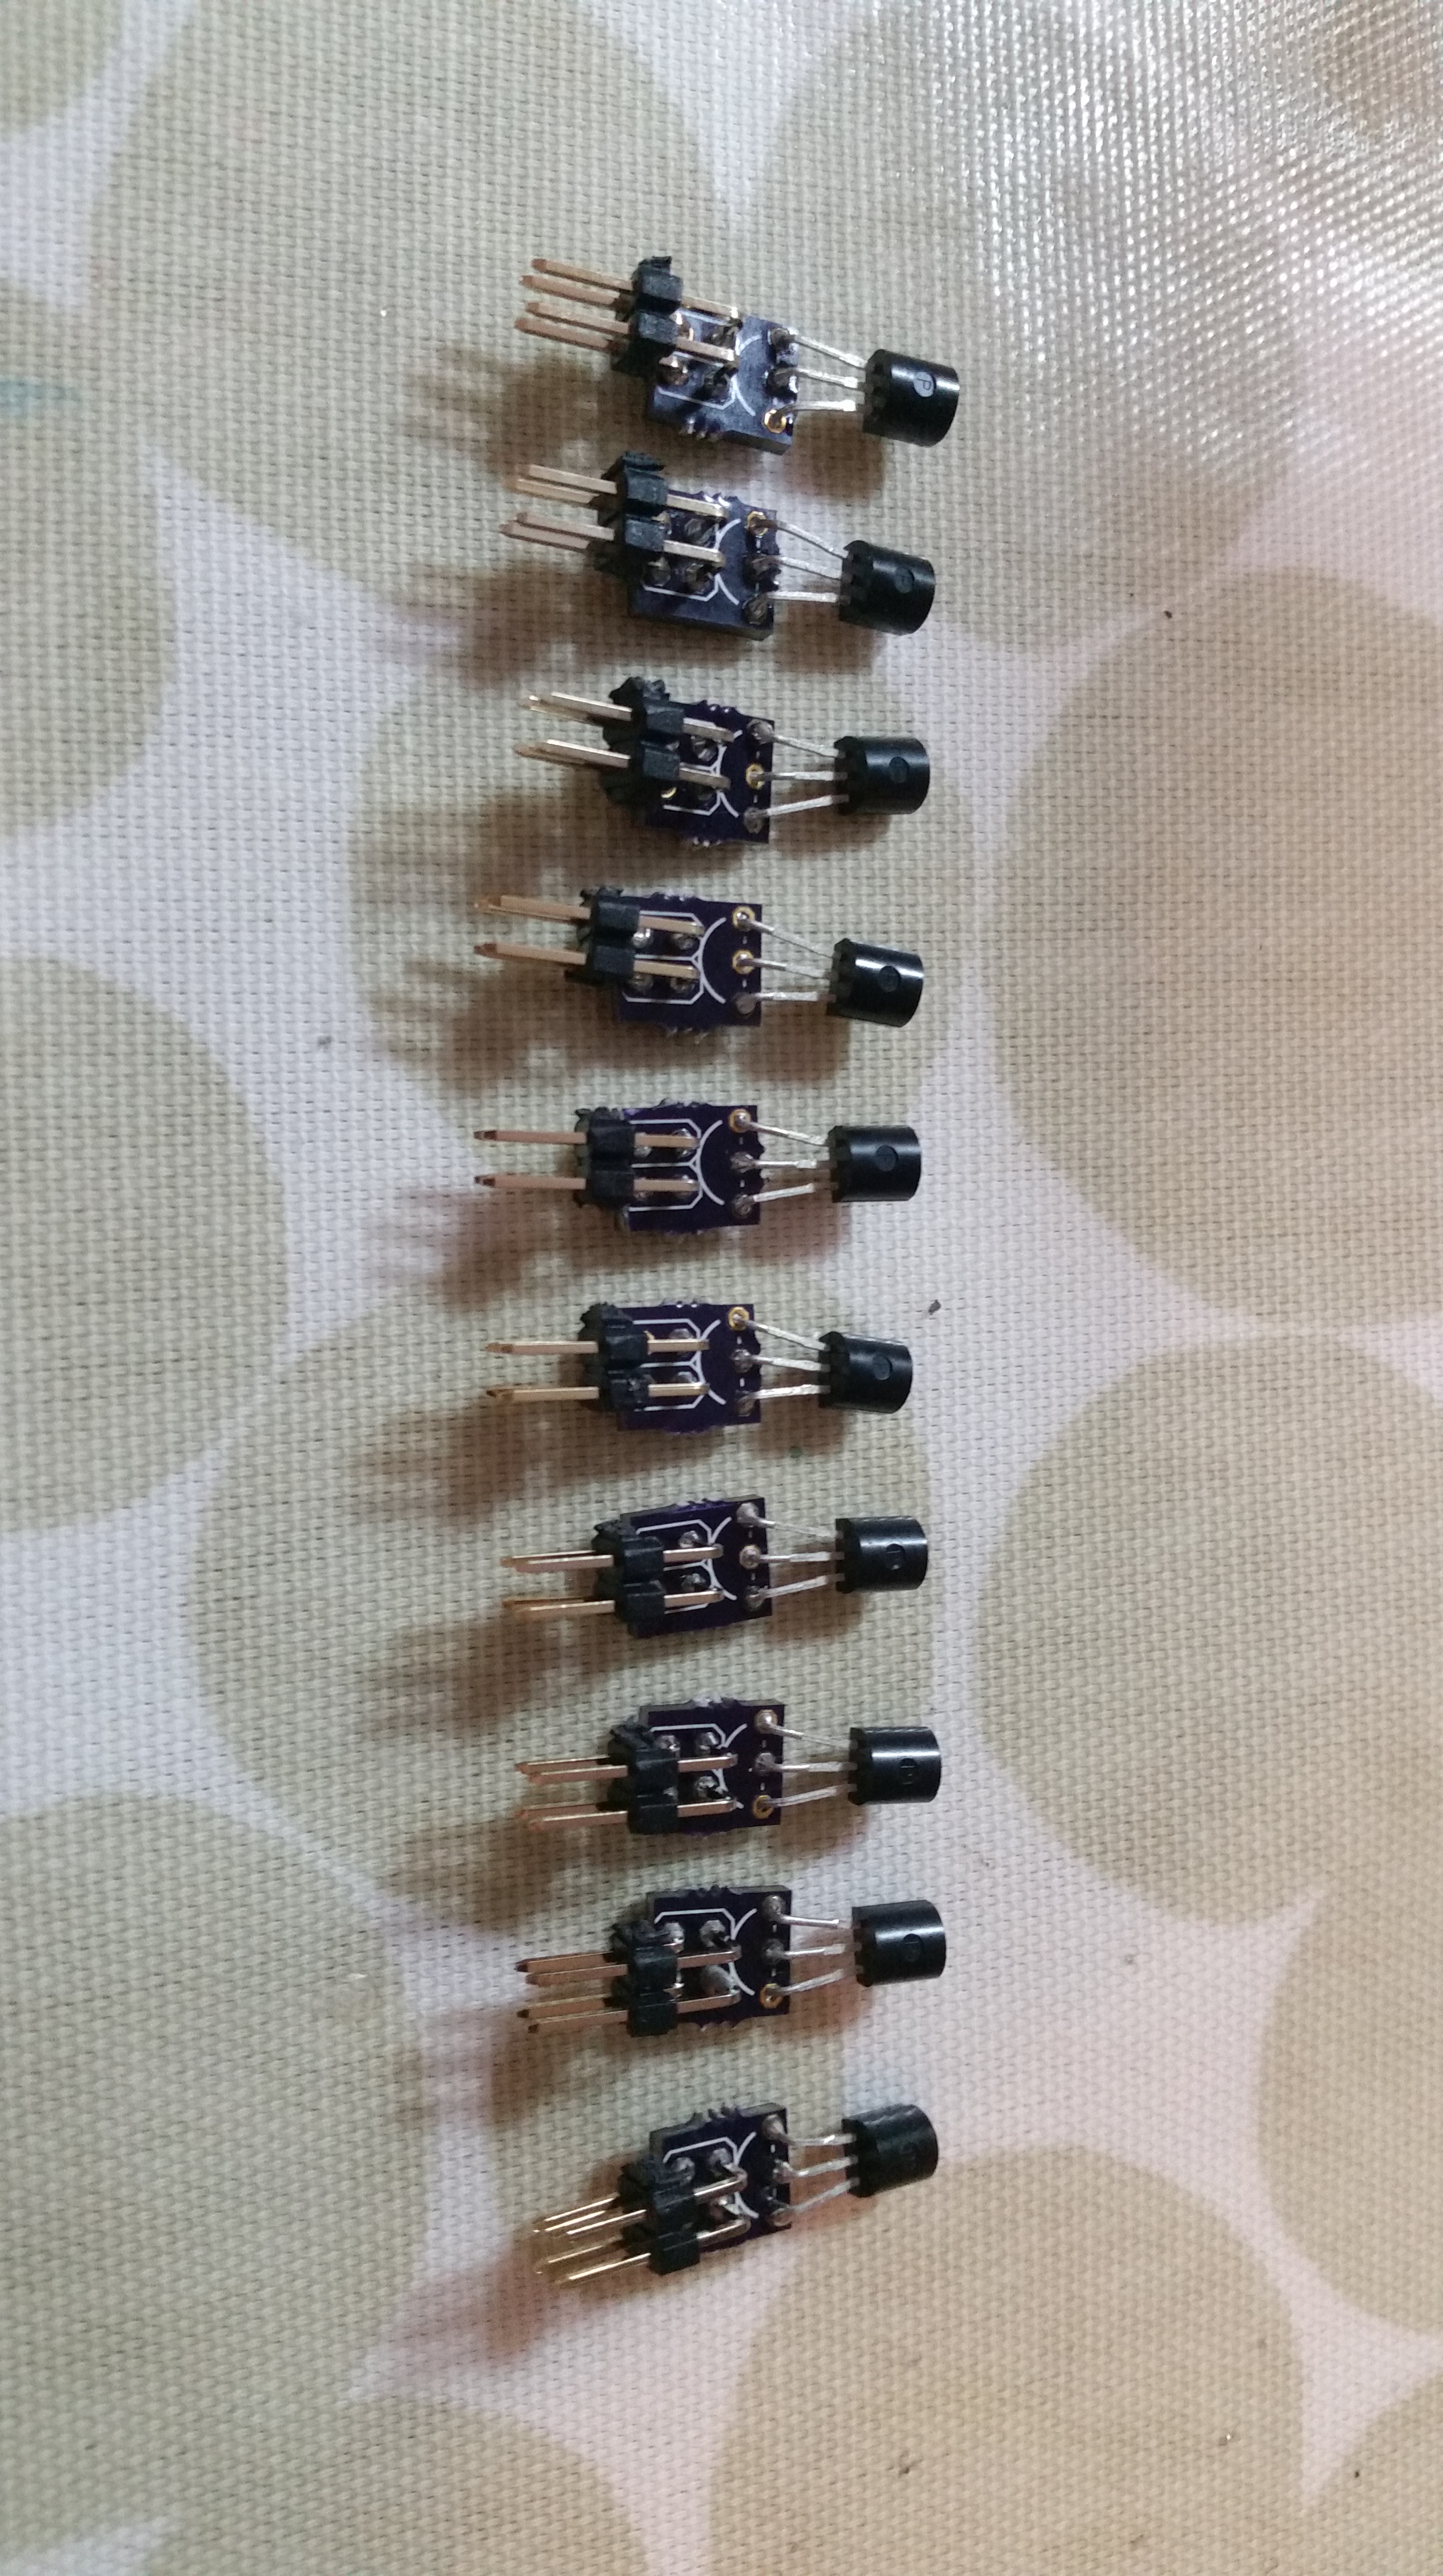
I am using the MAX31820 1-wire temperature sensors. They have a simple 3 pin transistor style package (TO-92) and there are lots of existing libraries and support for them. They’re also cheap. I decided to connect them using a ribbon cable, so I made little PCBs for them with a 4 pin header, to make the ribbon cable connection easy. I ended up using 6 way ribbon cable with 6 pin sockets, as it turns out 4 pin IDC sockets are a very difficult to find, where as 6 pin sockets are cheap as chips.

MAX31820 1-wire temperature sensor mounting PCB

MAX31820 1-wire temperature sensors on small PCBs

Example MAX31820 1-wire temperature sensors on small PCB attached to a ribbon cable
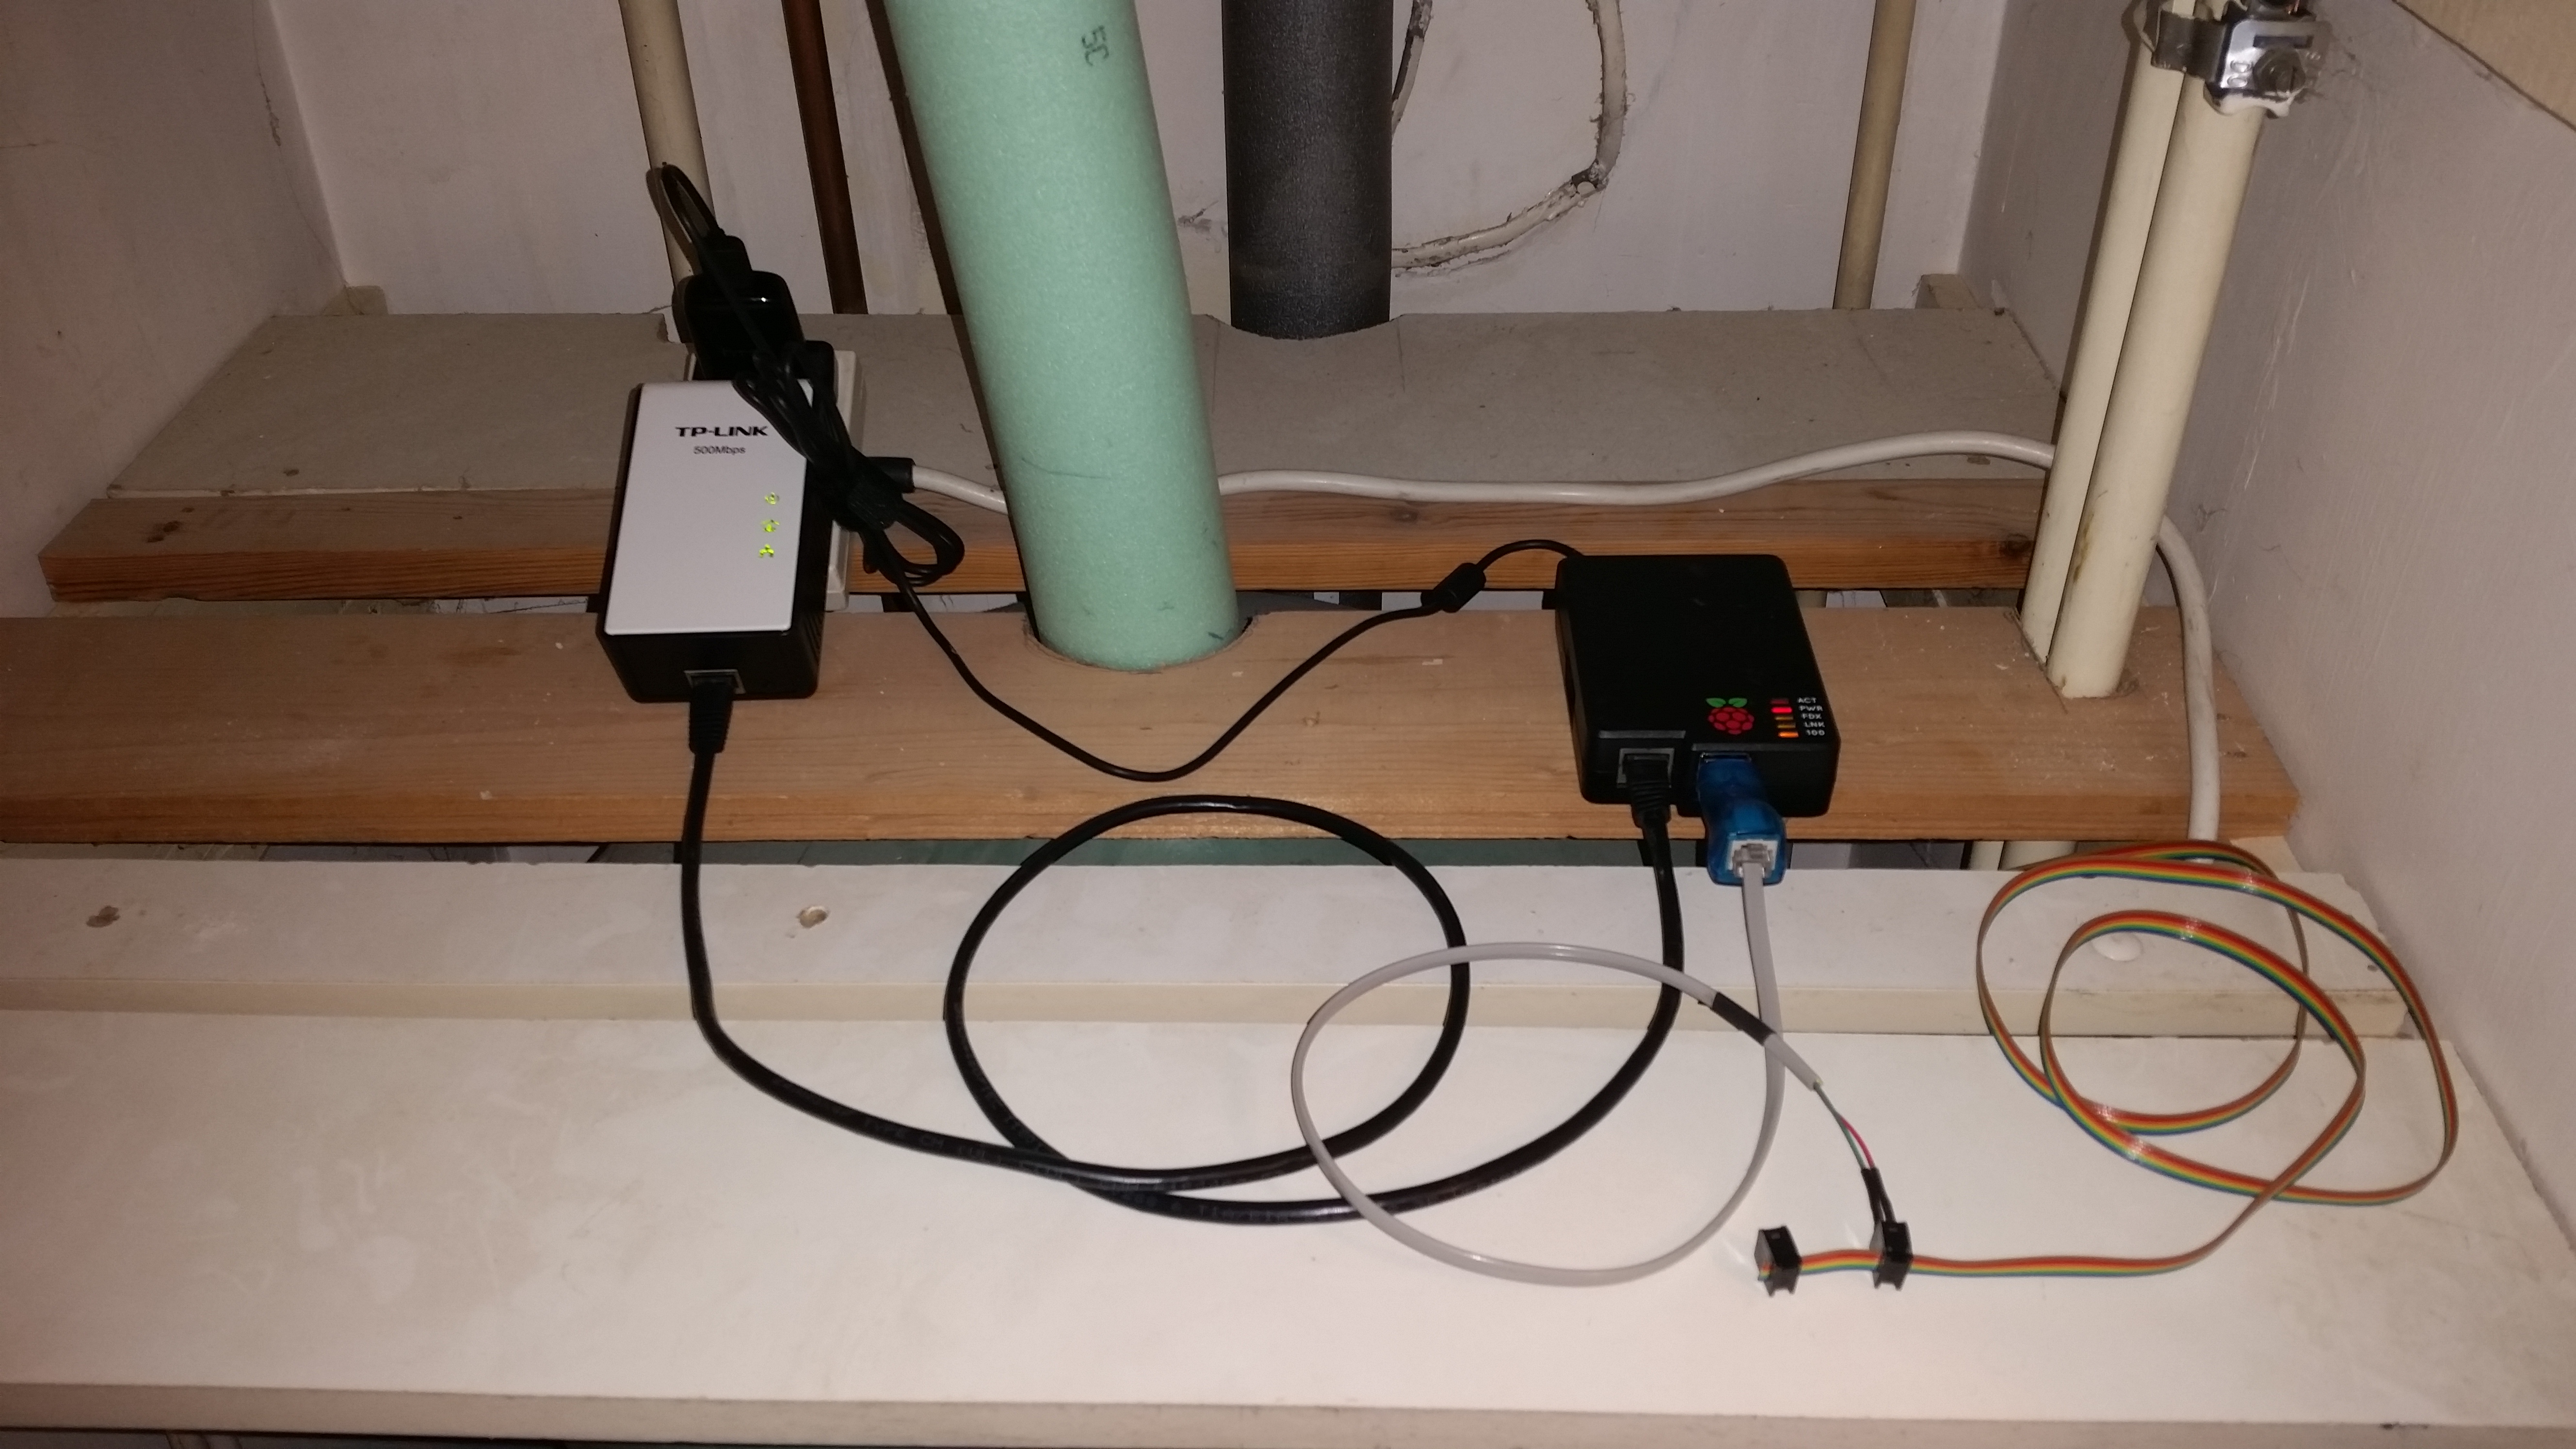
I already had a USB Adapter for 1-wire, which conveniently is supported by most of the 1-wire Raspberry Pi libraries. However, there are lots of ways of connecting 1-wire devices to a Raspberry Pi. The USB adapter is DS9490R. It takes an RJ11 plug to connect to the 1-wire bus, which also conveniently attaches to my ribbon cable. So, the solution is surprisingly neat.
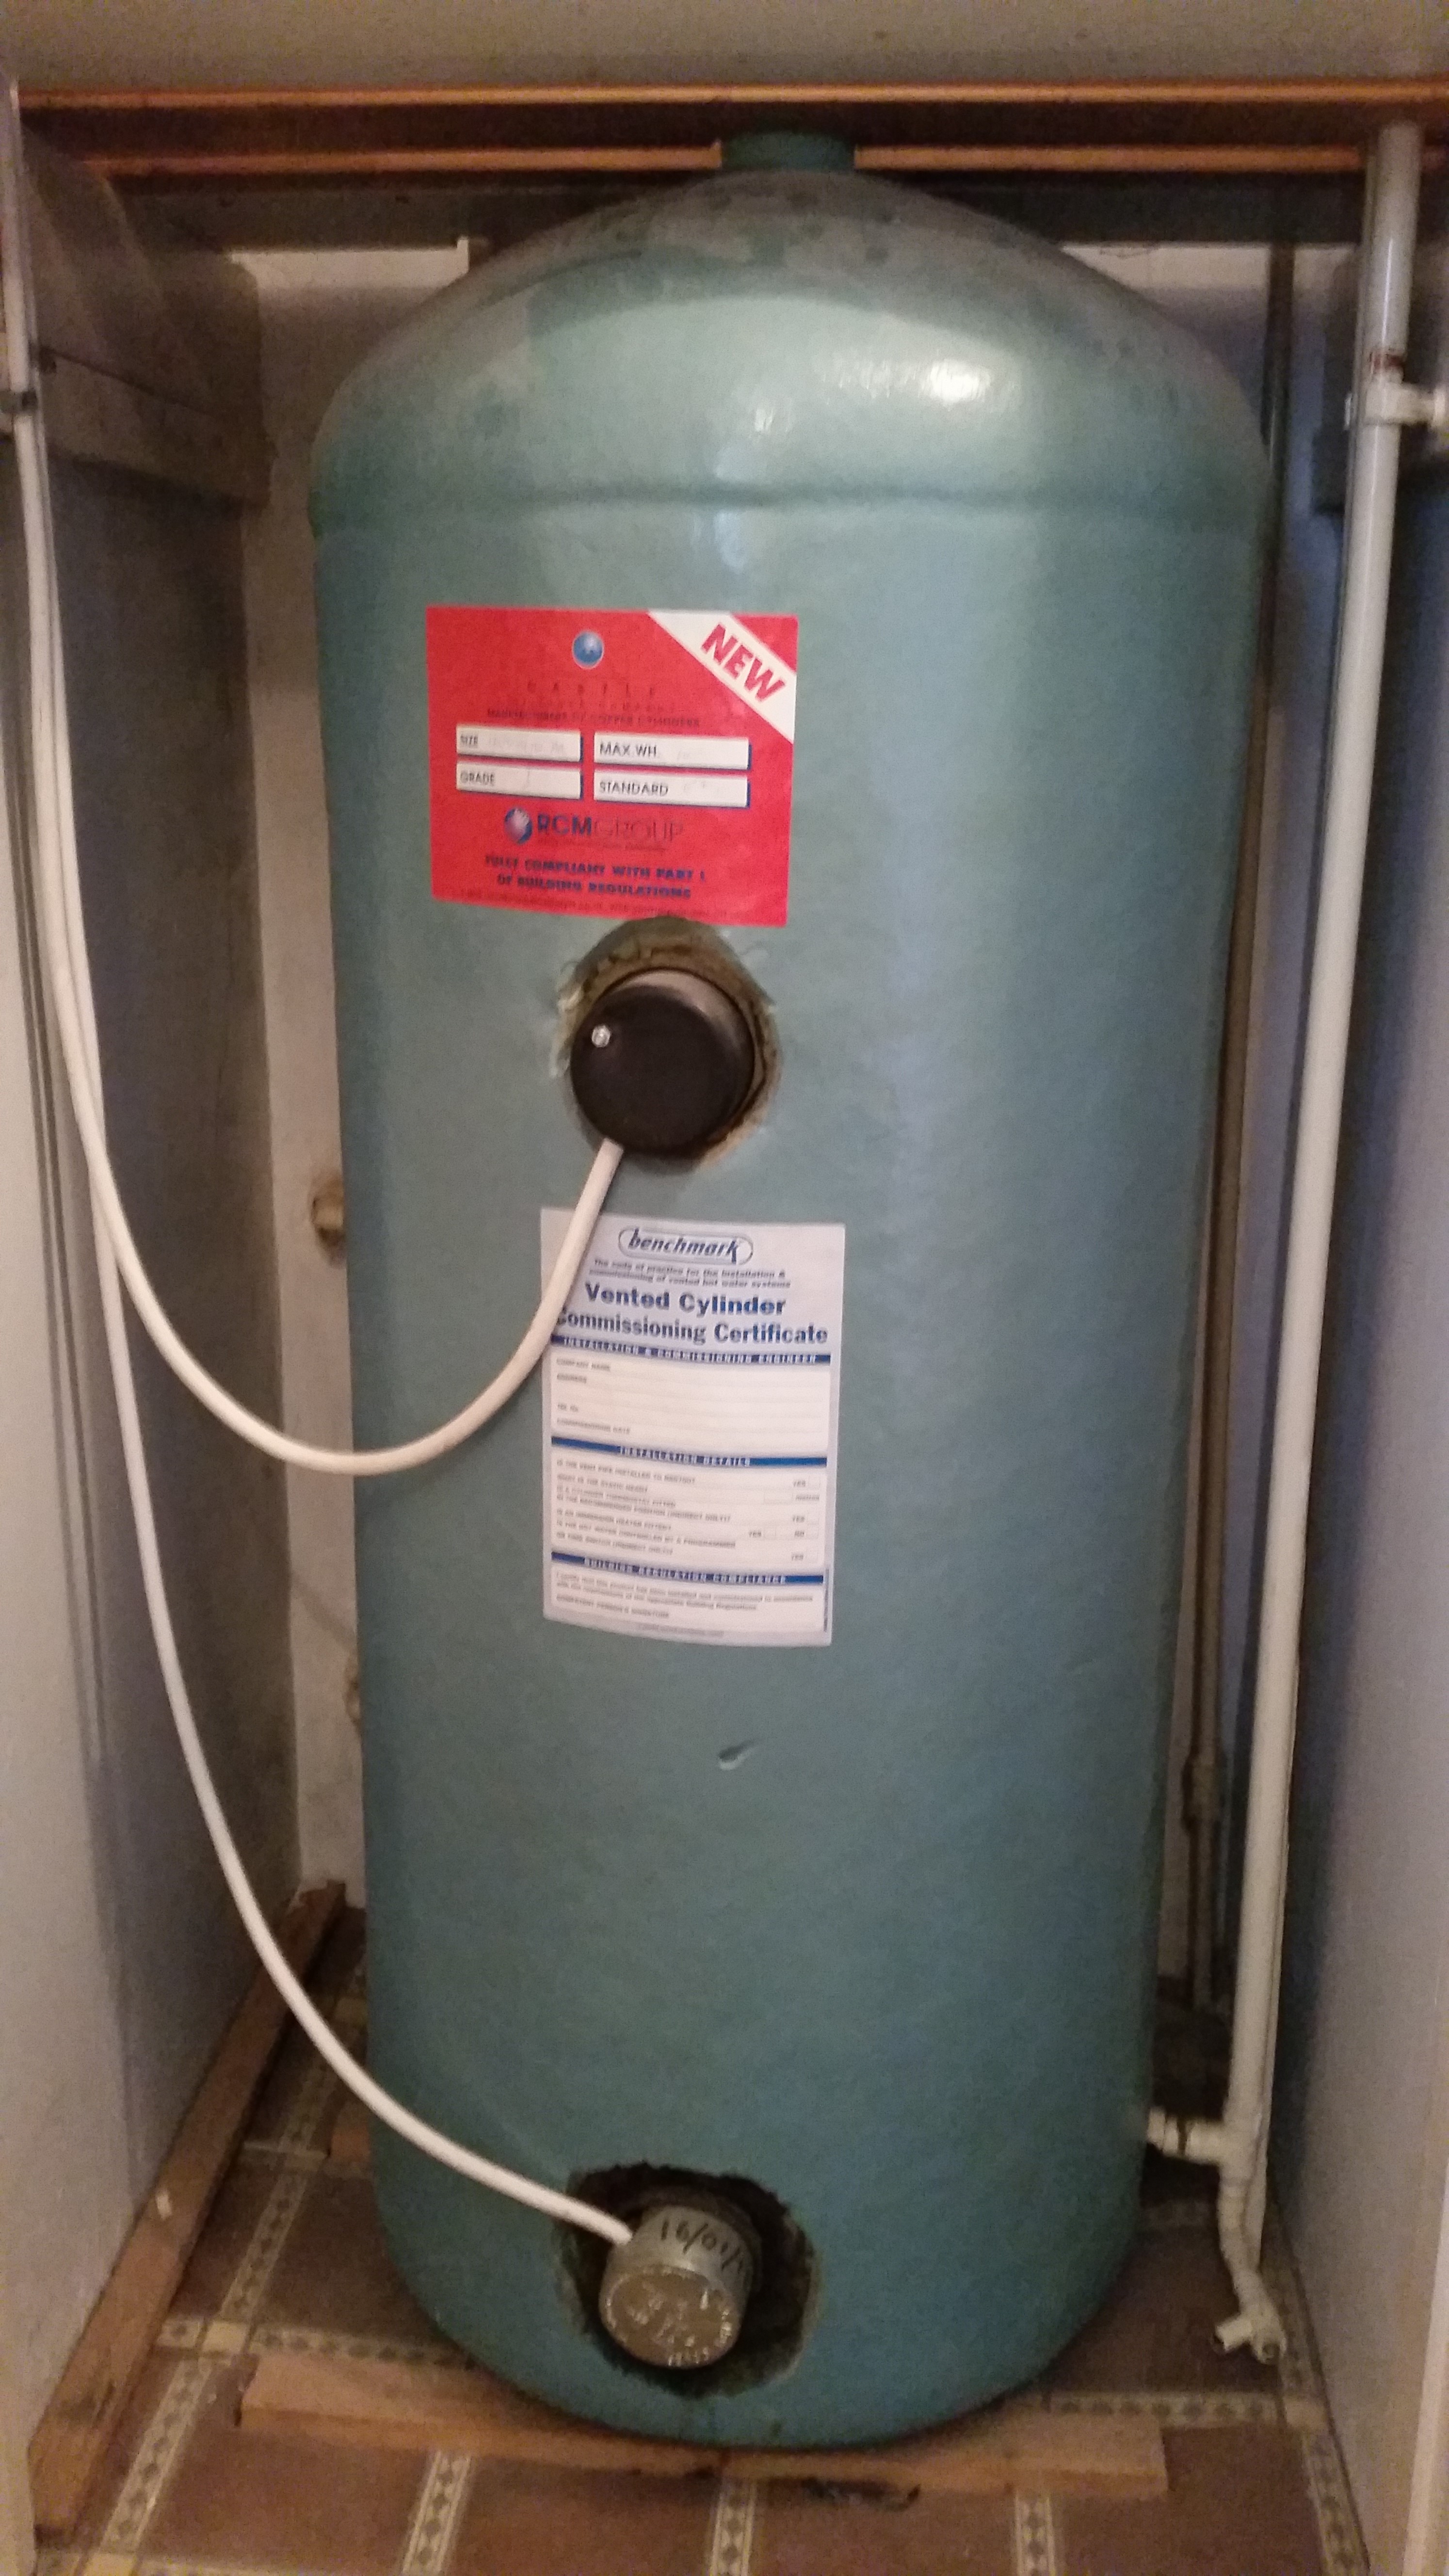
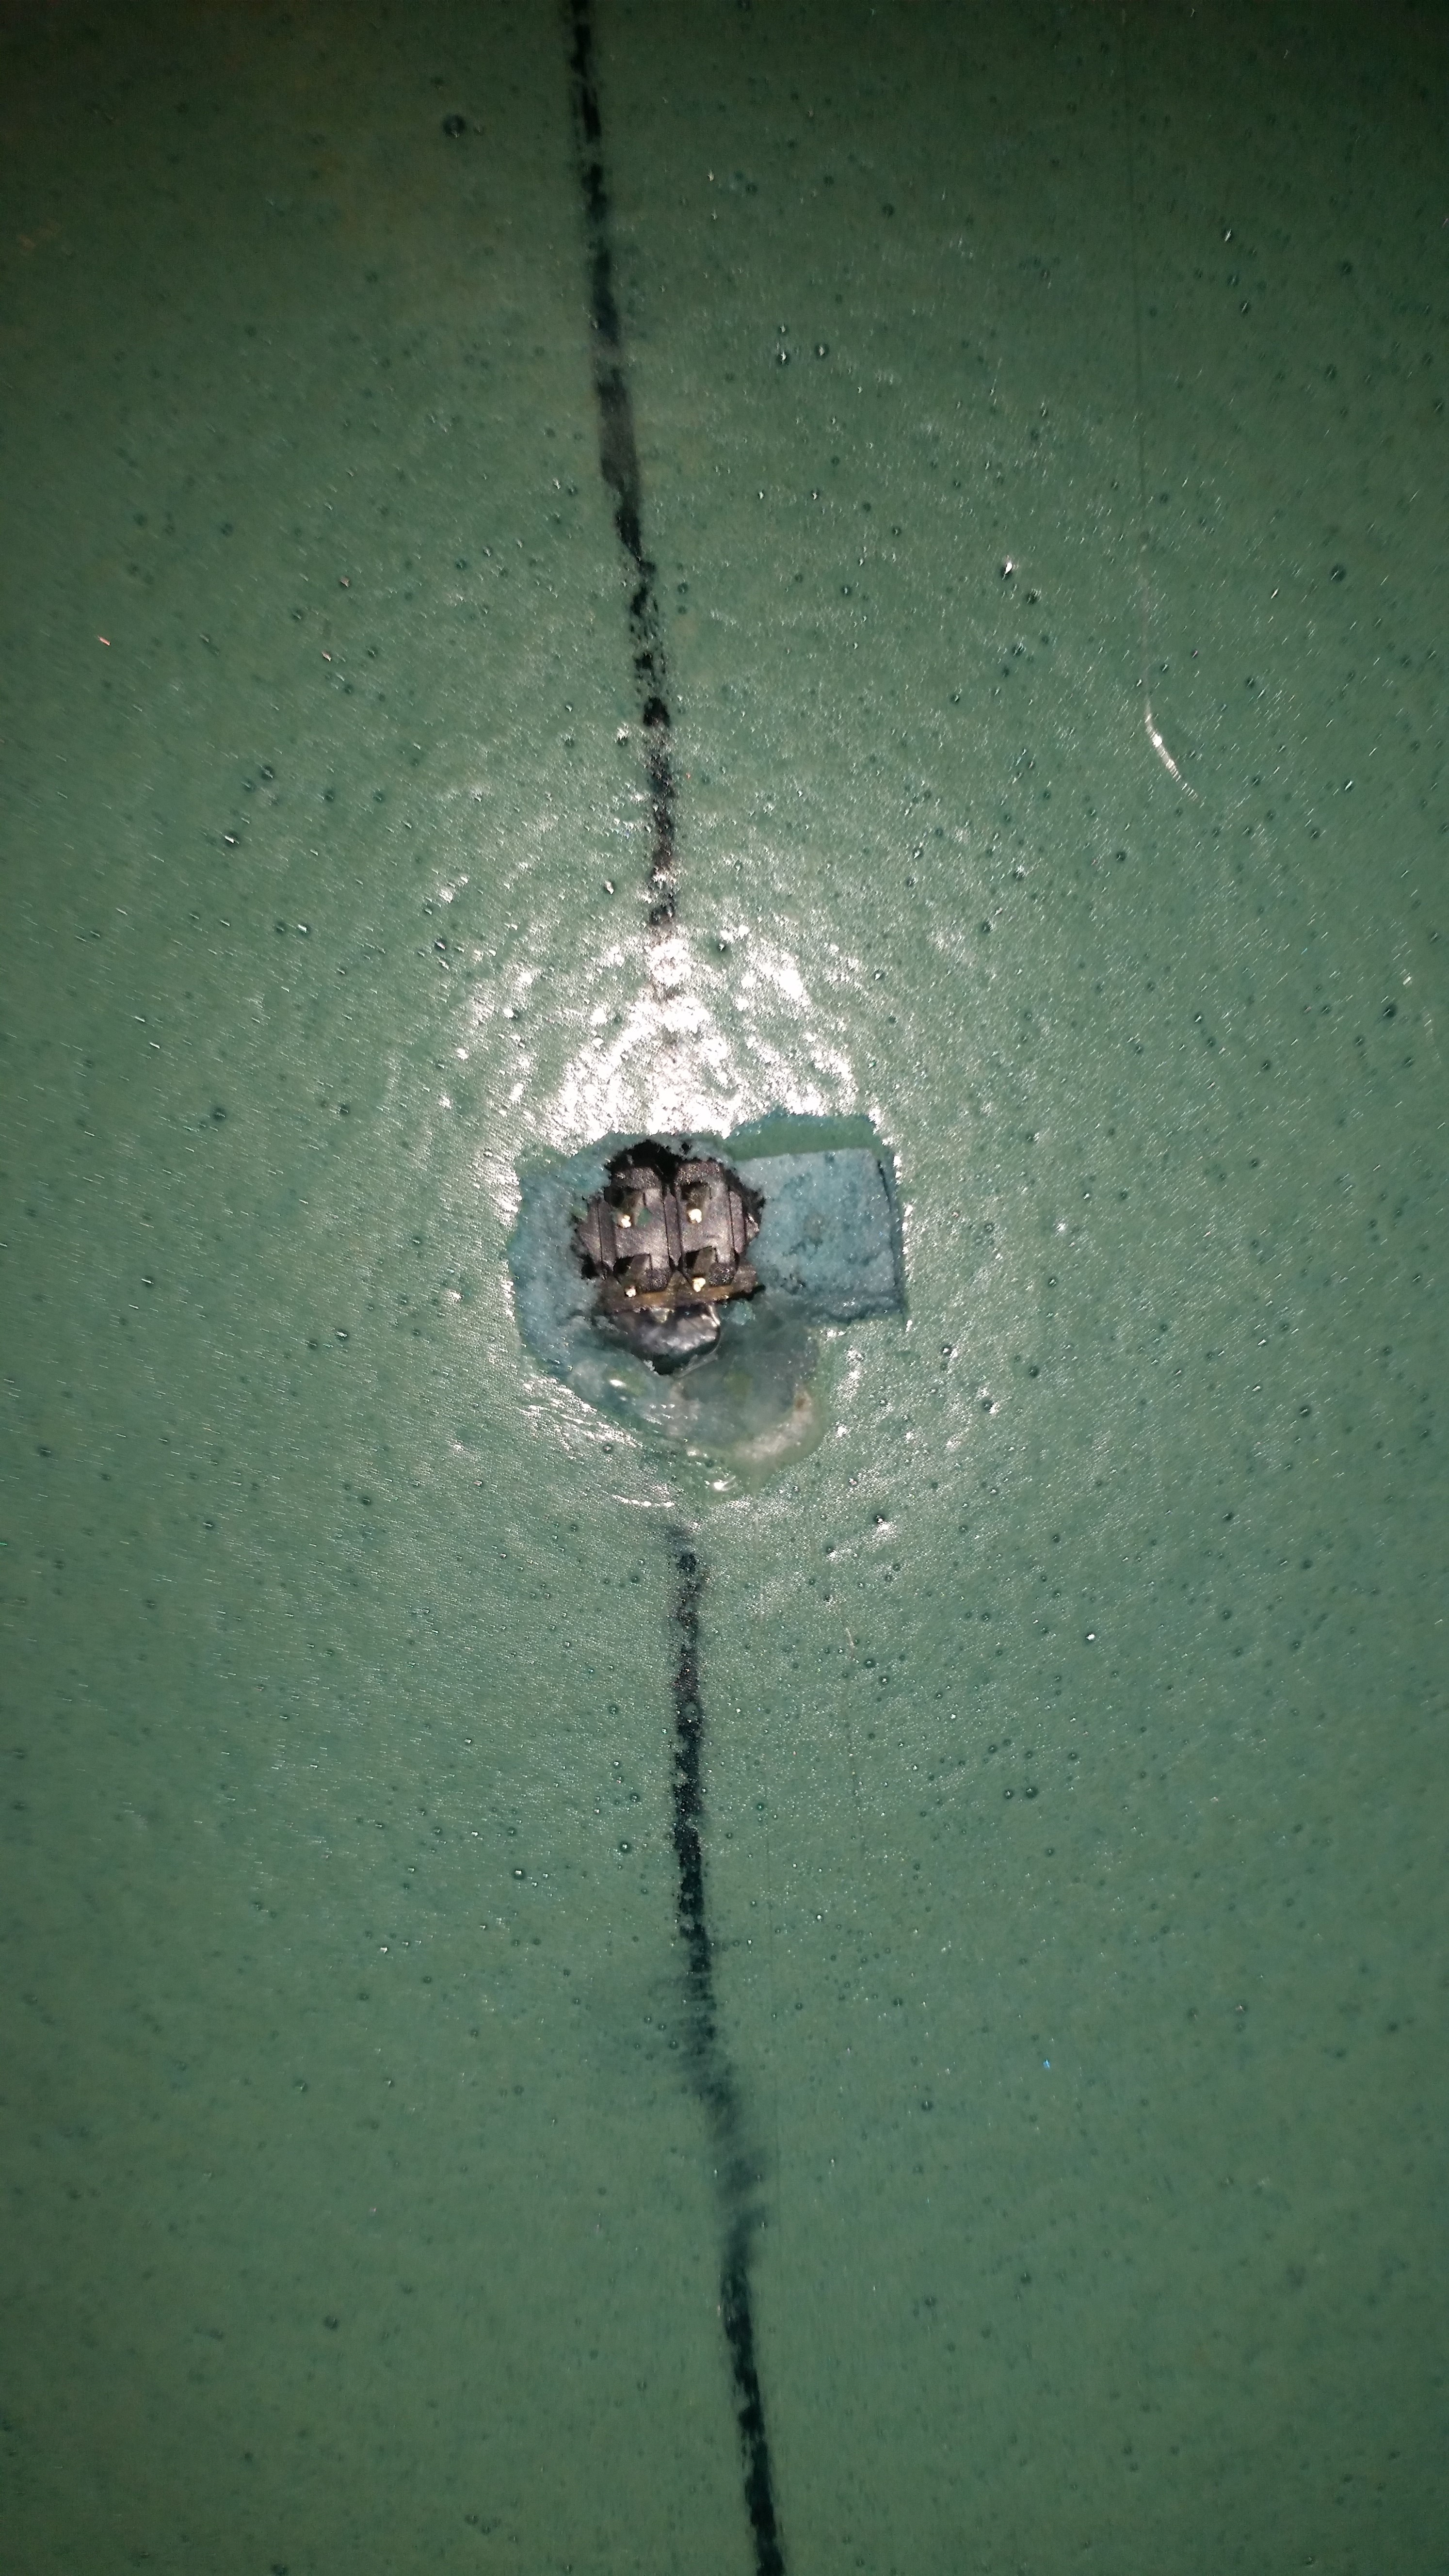
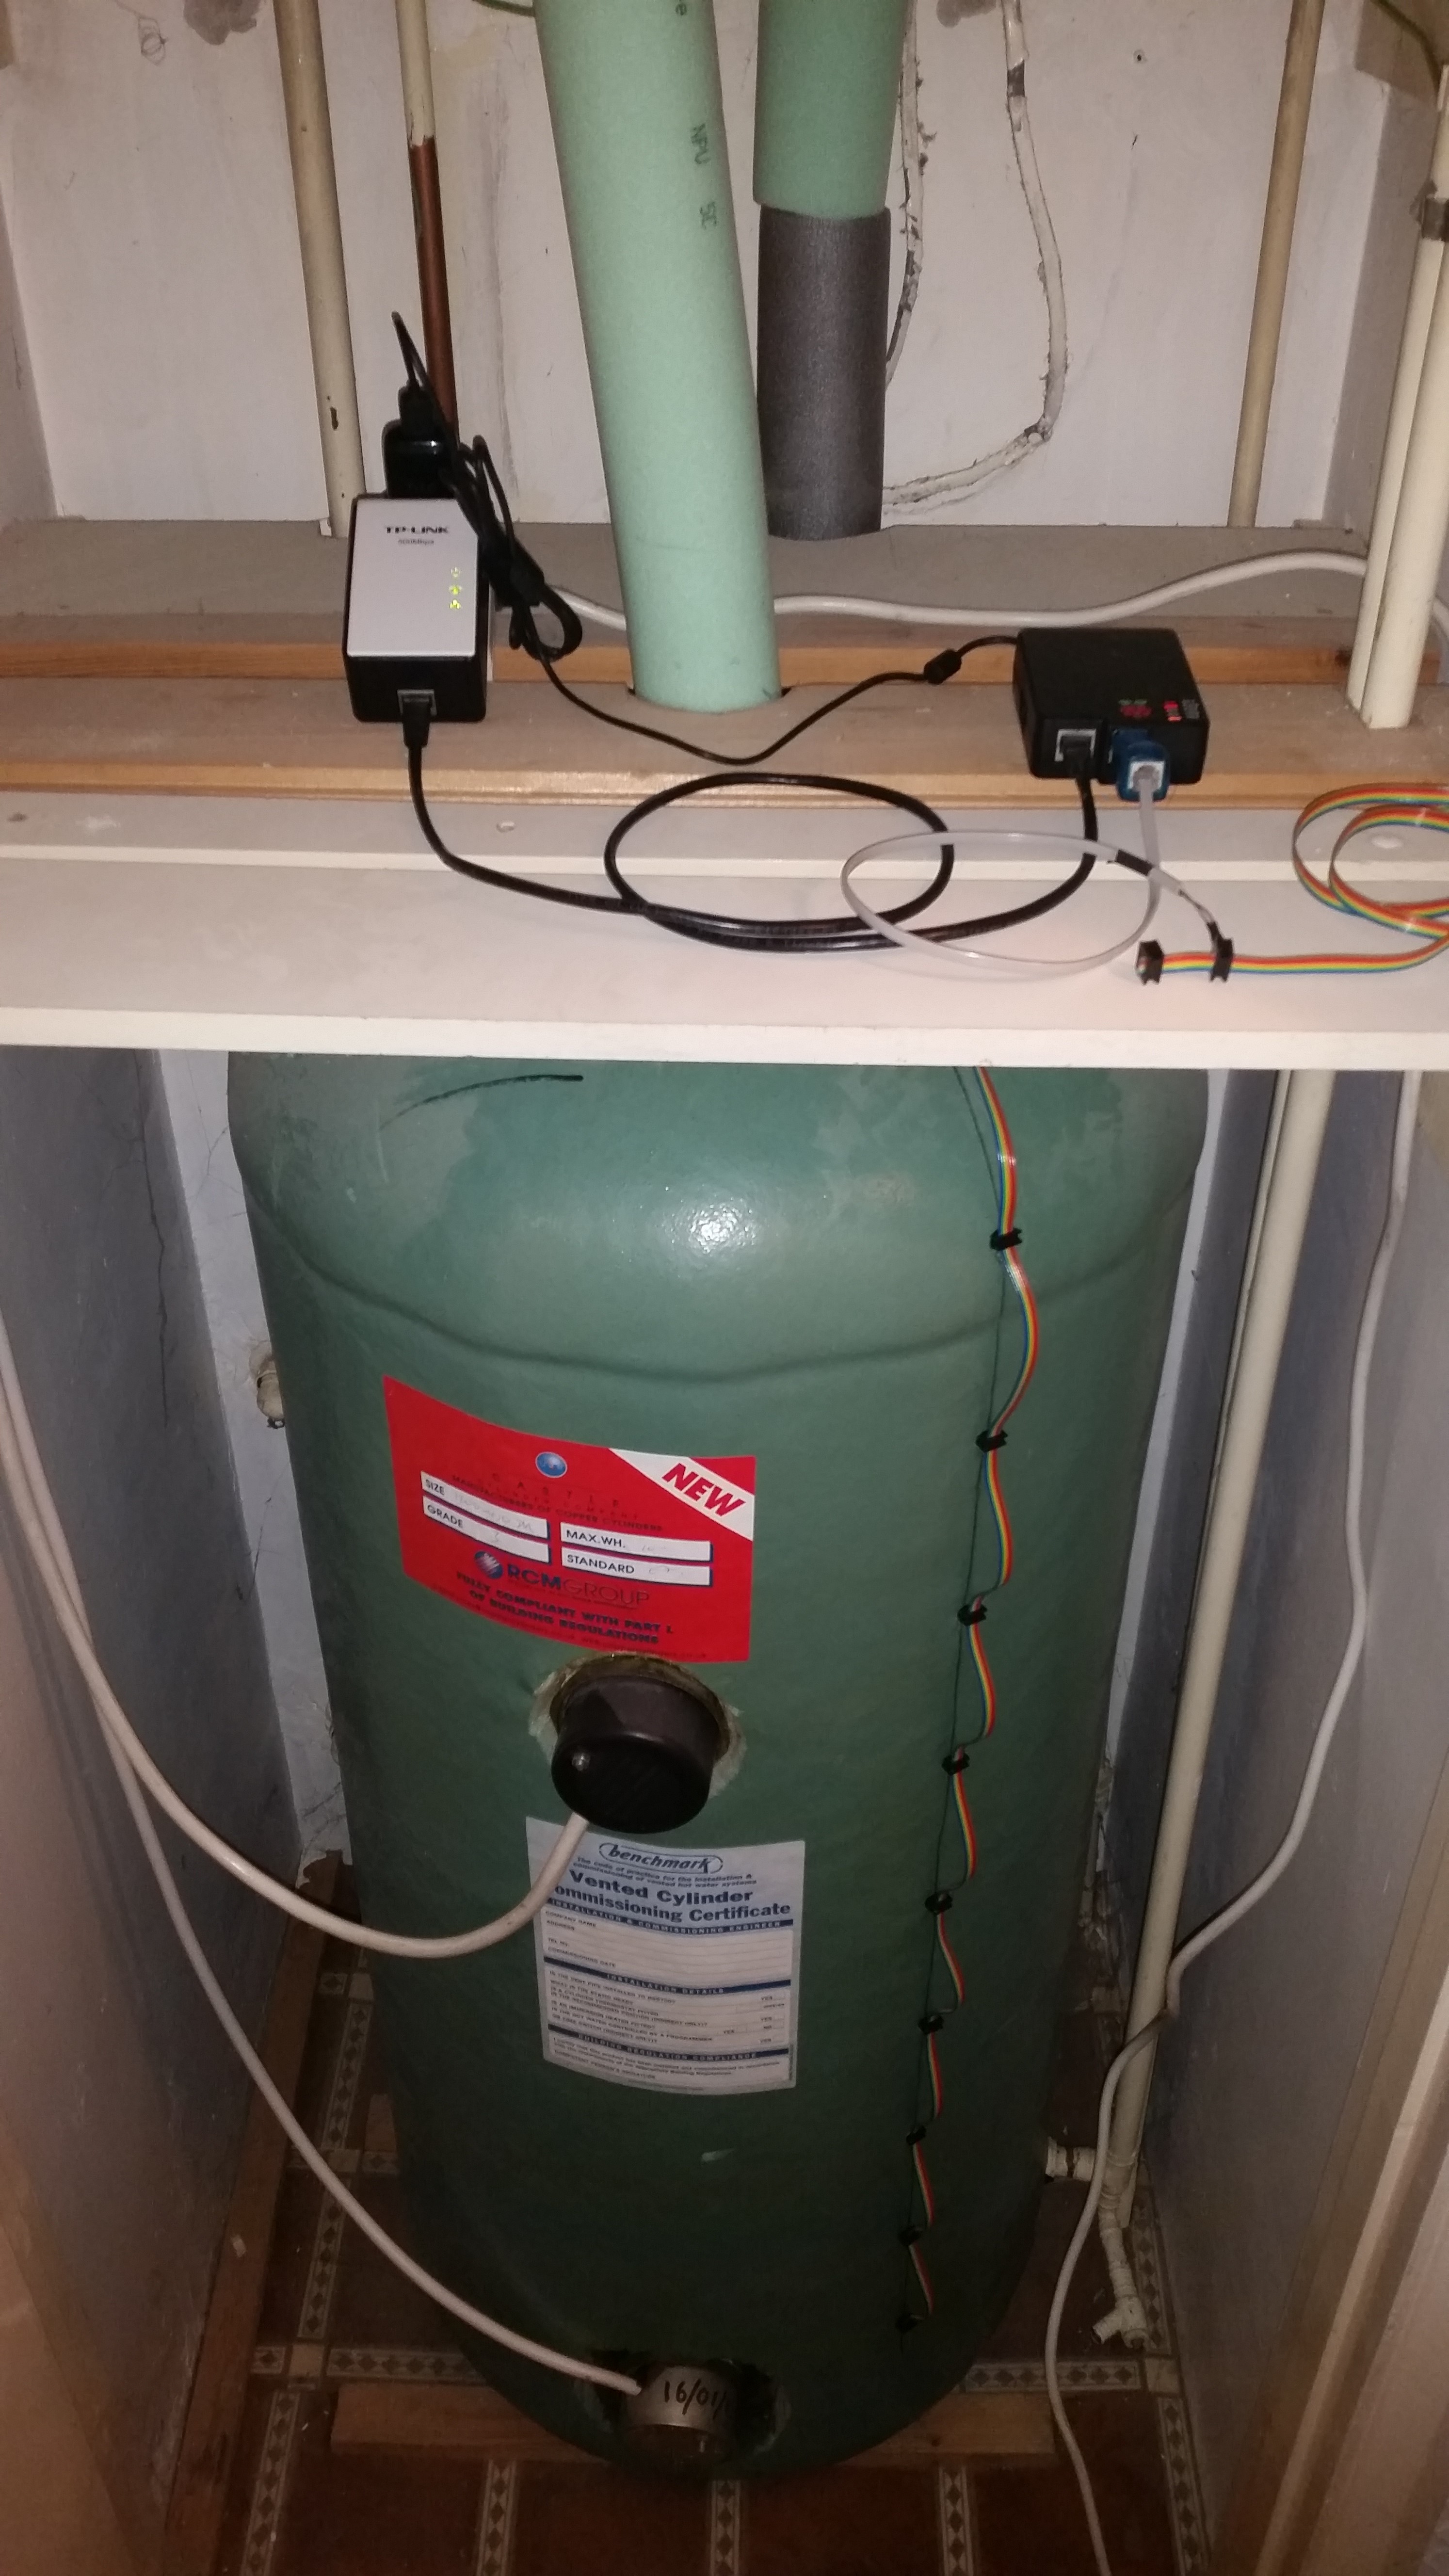
The tank is pretty standard. Its covered in a insulated foam. I arbitrarily decided that 10 sensors was probably enough resolution. I marked the tank and made 10 equally spaced holes in the insulation with a pencil, then cleaned out the foam with the eraser end of the pencil, until I could see the shiny copper. I dabbed a blob of thermal paste in each hole, to assist with heat transfer from the copper tank to the temperature sensor, as I wouldn’t get direct mechanical contact. The boards and sensors just friction fitted in to the holes, and are kept in by the resistance of the foam on the boards. They are pretty snug and don’t fall out.
The cabling is simple, just attaching IDC connectors at the same regular intervals and then connecting the string of sensors to the Raspberry Pi.

Hot water tank

Hot water tank with holes for temperature sensors marked

Hole in the foam insulation showing the shiny copper tank

Temperature sensor on mounting board inserted in the foam insulation

Temperature sensors wired together with ribbon cable

Raspberry Pi connected via USB 1-wire adapter to string of sensors

Raspberry Pi connected via USB 1-wire adapter to string of sensors
Once the sensors were mounted and connected I installed OWFS (One Wire Filing System) on the Raspberry Pi which is a really easy way to read 1-wire sensors. It maps all the sensors found on the bus to a file system, so by reading the files you can read all the data and configure of all the connected sensors. Again there are loads of ways to access 1-wire devices. Using OWFS just made it easy for me. You could use Python or C, or any other myriad of languages, which all have 1-wire libraries.
Here are some instructions to install OWFS on a Raspberry Pi.
The OWFS maps the devices to a mount point. If you list the contents you get something like this :
root@raspberrypi:# cd /mnt/1wire/
root@raspberrypi:/mnt/1wire# ls -la
total 4
drwxr-xr-x 1 root root 4096 Nov  4 16:17 .
drwxr-xr-x 3 root root 4096 Mar  3  2015 ..
drwxrwxrwx 1 root root 4096 Mar 20 19:46 28.0BA759050000
drwxrwxrwx 1 root root 4096 Mar 20 19:46 28.168F59050000
drwxrwxrwx 1 root root 4096 Mar 20 19:46 28.229659050000
drwxrwxrwx 1 root root 4096 Mar 20 19:46 28.33A559050000
drwxrwxrwx 1 root root 4096 Mar 20 19:46 28.49B159050000
drwxrwxrwx 1 root root 4096 Mar 20 19:46 28.849459050000
drwxrwxrwx 1 root root 4096 Mar 20 19:46 28.AAB059050000
drwxrwxrwx 1 root root 4096 Mar 20 19:46 28.BBA459050000
drwxrwxrwx 1 root root 4096 Mar 20 19:46 28.C8AA59050000
drwxrwxrwx 1 root root 4096 Mar 20 19:46 28.E6B059050000
drwxrwxrwx 1 root root 4096 Mar 20 19:46 81.E1E324000000
drwxr-xr-x 1 root root 4096 Nov  4 16:17 alarm
drwxr-xr-x 1 root root 4096 Nov  4 16:17 bus.0
drwxr-xr-x 1 root root 4096 Nov  4 16:17 settings
drwxrwxrwx 1 root root 4096 Mar 20 19:46 simultaneous
drwxr-xr-x 1 root root 4096 Nov  4 16:17 statistics
drwxr-xr-x 1 root root 4096 Nov  4 16:17 structure
drwxr-xr-x 1 root root 4096 Nov  4 16:17 system
drwxr-xr-x 1 root root 4096 Nov  4 16:17 uncached
In each directory you can read either the cached or uncached version of the data, plus other details about the device.
root@raspberrypi:/mnt/1wire/28.0BA759050000# ls -la
total 0
drwxrwxrwx 1 root root 4096 Mar 20 19:46 .
drwxr-xr-x 1 root root 4096 Nov  4 16:17 ..
-r--r--r-- 1 root root   16 Nov  4 16:17 address
-rw-rw-rw- 1 root root  256 Nov  4 16:17 alias
-r--r--r-- 1 root root    2 Nov  4 16:17 crc8
drwxrwxrwx 1 root root 4096 Mar 20 19:46 errata
-r--r--r-- 1 root root    2 Nov  4 16:17 family
-r--r--r-- 1 root root   12 Nov  4 16:17 fasttemp
-r--r--r-- 1 root root   12 Nov  4 16:17 id
-r--r--r-- 1 root root   16 Nov  4 16:17 locator
-r--r--r-- 1 root root    1 Mar 20 19:46 power
-r--r--r-- 1 root root   16 Nov  4 16:17 r_address
-r--r--r-- 1 root root   12 Nov  4 16:17 r_id
-r--r--r-- 1 root root   16 Nov  4 16:17 r_locator
-r--r--r-- 1 root root    9 Mar 20 19:46 scratchpad
-r--r--r-- 1 root root   12 Nov  4 16:17 temperature
-r--r--r-- 1 root root   12 Nov  4 16:17 temperature10
-r--r--r-- 1 root root   12 Nov  4 16:17 temperature11
-r--r--r-- 1 root root   12 Nov  4 16:17 temperature12
-r--r--r-- 1 root root   12 Nov  4 16:17 temperature9
-rw-rw-rw- 1 root root   12 Mar 20 19:46 temphigh
-rw-rw-rw- 1 root root   12 Mar 20 19:46 templow
-r--r--r-- 1 root root   32 Nov  4 16:17 type

root@raspberrypi:/mnt/1wire/28.0BA759050000# cat address
280BA759050000FA

root@raspberrypi:/mnt/1wire/28.0BA759050000# cat family
28

root@raspberrypi:/mnt/1wire/28.0BA759050000# cat temperature
51.375

root@raspberrypi:/mnt/1wire/28.0BA759050000#
I run a shell script every 5 minutes to read the latest data from all the sensors and store it in a text file.
> cat /root/scripts/logtemp.sh

#!/bin/sh
date | tr -d '\n' >> /home/pi/templog.txt
echo -n ',' >> /home/pi/templog.txt
cat /mnt/1wire/28.E6B059050000/temperature >> /home/pi/templog.txt
echo -n ',' >> /home/pi/templog.txt
cat /mnt/1wire/28.0BA759050000/temperature >> /home/pi/templog.txt
echo -n ',' >> /home/pi/templog.txt
cat /mnt/1wire/28.49B159050000/temperature >> /home/pi/templog.txt
echo -n ',' >> /home/pi/templog.txt
cat /mnt/1wire/28.168F59050000/temperature >> /home/pi/templog.txt
echo -n ',' >> /home/pi/templog.txt
cat /mnt/1wire/28.C8AA59050000/temperature >> /home/pi/templog.txt
echo -n ',' >> /home/pi/templog.txt
cat /mnt/1wire/28.33A559050000/temperature >> /home/pi/templog.txt
echo -n ',' >> /home/pi/templog.txt
cat /mnt/1wire/28.849459050000/temperature >> /home/pi/templog.txt
echo -n ',' >> /home/pi/templog.txt
cat /mnt/1wire/28.BBA459050000/temperature >> /home/pi/templog.txt
echo -n ',' >> /home/pi/templog.txt
cat /mnt/1wire/28.229659050000/temperature >> /home/pi/templog.txt
echo -n ',' >> /home/pi/templog.txt
cat /mnt/1wire/28.AAB059050000/temperature >> /home/pi/templog.txt
echo ',END' >> /home/pi/templog.txt
I then use this data from a simple web page written in Python to display the latest temperatures in the tank. I decided 35 degrees Celsius is “cold”. If the water is below this I show it as blue (Cold), if its above this I show it as red (Hot). This is open to future expansion where I can fade the colour from red to blue depending on the temperature, more red for hot, more blue for cold, rather than a single colour, but that’s for another day.
> cat hotwater.py

#!/usr/bin/env python
import cgi
import cgitb
cgitb.enable()

form = cgi.FieldStorage()

print 'Content-type: text/html\n\n'
print '<html><head></head><body>'

fn = '/home/pi/templog-latest.txt'
f = open(fn, 'r')
t = f.readline()
f.close()

temps = t.split(',')

o = ''

if form.getvalue("up","true") == 'true':
        up = True
else:
        up = False

for temp in temps:
        if len(temp) > 8:
                d = temp +"<br>"
        elif len(temp) < 2:
                if up:
                        o = o +'<tr><td bgcolor="#00FF00" align="center"></td></tr>'
                else:
                        o = '<tr><td bgcolor="#00FF00" align="center"></td></tr>'+ o
        elif temp.strip('\n') == 'END':
                z = 1
        else :
                n = int(float(temp))
                if n > 35:
                        if up:
                                o = o +'<tr><td bgcolor="#FF0000" align="center">'+ str(n) +'</td></tr>'
                        else:
                                o = '<tr><td bgcolor="#FF0000" align="center">'+ str(n) +'</td></tr>'+ o
                else:
                        if up:
                                o = o +'<tr><td bgcolor="#0000FF" align="center">'+ str(n) +'</td></tr>'
                        else:
                                o = '<tr><td bgcolor="#0000FF" align="center">'+ str(n) +'</td></tr>'+ o

print d +'<table width=150>'+ o +'</table>'
print '</body></html>'
I can access the web page from anywhere in my house, on my mobile phone, and it instantly shows the quantity of hot water left in the tank, plus each of the 10 individual temperature readings from the sensors. The query string parameter in the web page script reverses the order of the sensor readings in the tank. “up=false” or with no query string, is the default setting, where the temperatures are shown in the correct order, with the hottest water “floating” at the top of the tank. The alternate view, is for users who don’t want a view based on physics, and would rather the visualise a tank full of hot water emptying from the bottom. In this view the hot water is seen at the bottom, slowly draining away to empty. Not scientifically correct, but easier to explain to my 8 year old. Either way the bookmark is saved with the appropriate query string parameter, and everyone in my house can now tell how much hot water is left, before they get in the shower. No more showers suddenly going cold half way through.

Hot water monitoring web page. This shows the tank about half full of hot water. The top of the tank at 45 degrees. The bottom of the tank at 16.